VISA (V)·Q1 2026 Earnings Summary
Visa Q1 FY2026 Earnings: Double Beat as Holiday Spending and Value-Added Services Drive 15% Revenue Growth
January 29, 2026 · by Fintool AI Agent
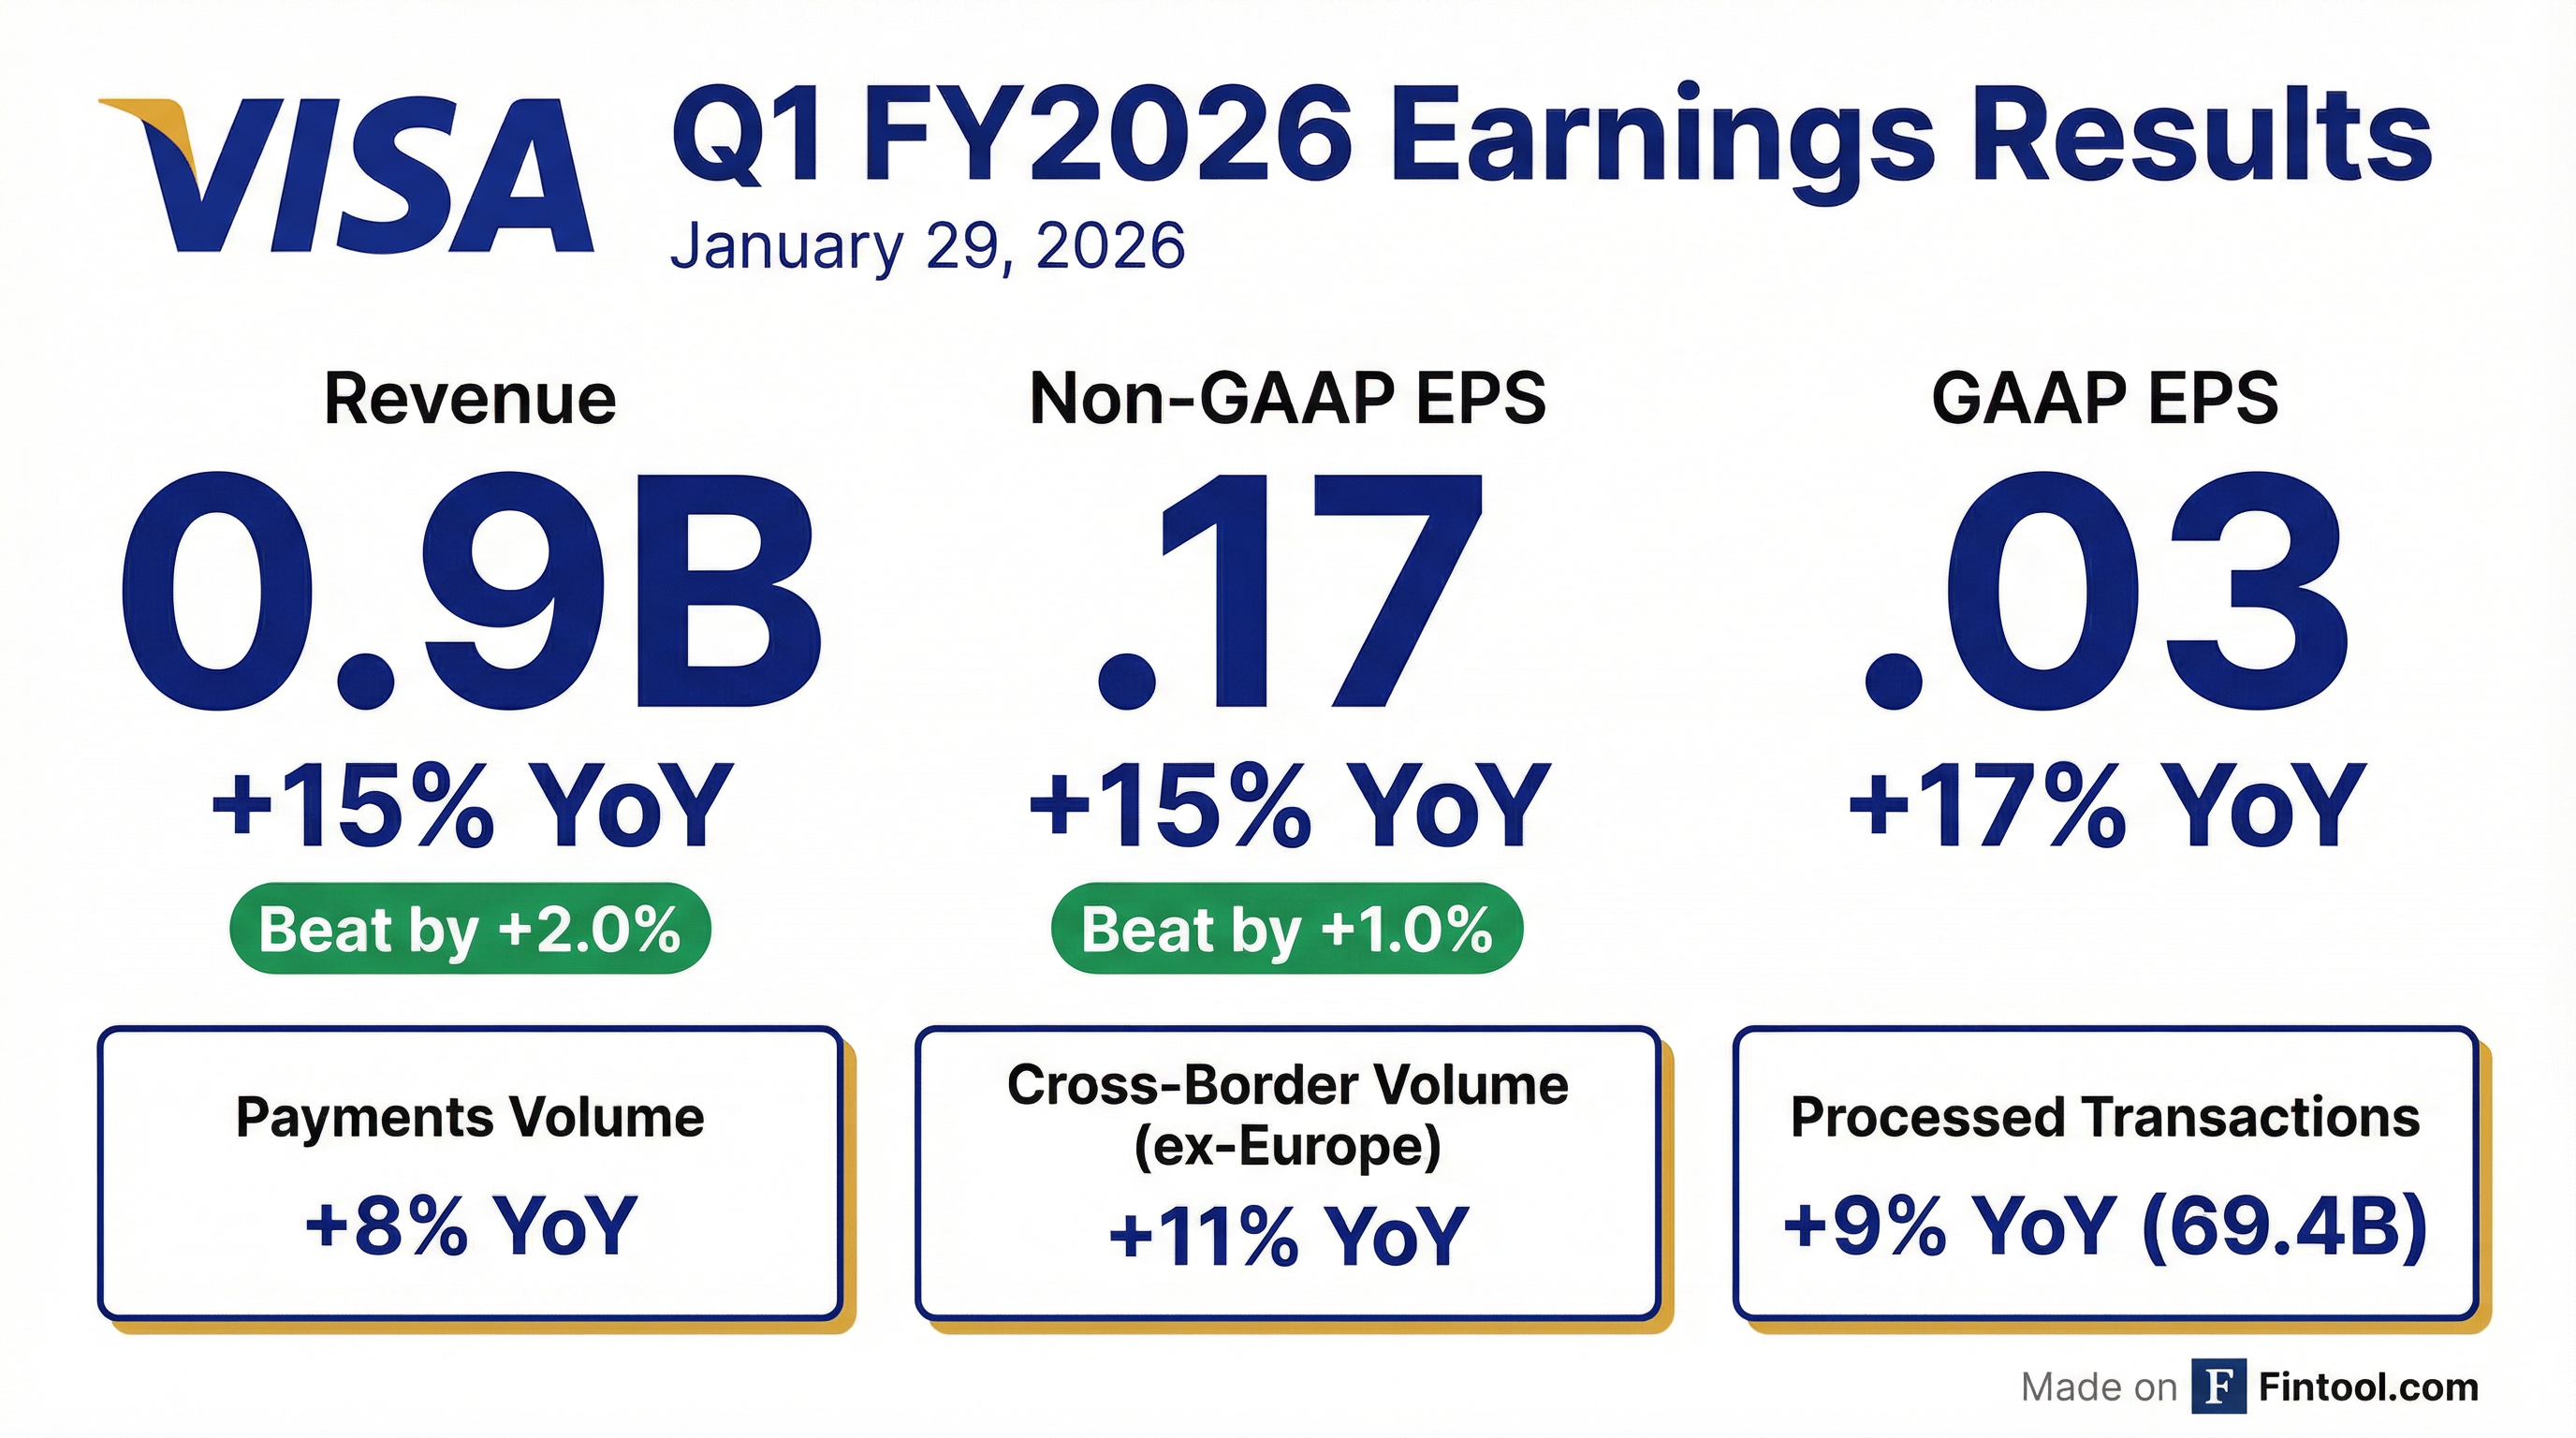
Visa delivered a strong fiscal first quarter, posting a double beat on revenue and earnings as resilient consumer spending during the holiday season combined with continued momentum in value-added services and commercial solutions. Net revenue of $10.9 billion grew 15% year-over-year (13% constant-dollar), while non-GAAP EPS of $3.17 climbed 15%.
The growth pillars outperformed: Value-Added Services revenue grew 28% (constant-dollar) and represented approximately 50% of overall revenue growth, while Commercial & Money Movement Solutions revenue grew 20% (constant-dollar).
CFO Chris Suh characterized the results: "We had a very strong start to our 2026 fiscal year, driven by strong driver growth, a strong holiday season, and continued execution of our strategy across consumer payments, commercial and money movement solutions, and value-added services."
Did Visa Beat Earnings?
Yes — Visa delivered a double beat on both revenue and EPS.
This marks Visa's eighth consecutive quarter of beating or meeting consensus on both revenue and EPS. The company has consistently delivered double beats throughout FY2025 and into FY2026.
What Were the Key Business Drivers?
All major volume metrics showed healthy growth, reflecting resilient consumer spending globally:
Cross-border volume excluding intra-Europe transactions — a key driver of international transaction revenue — maintained double-digit growth at 11%, demonstrating continued recovery and strength in cross-border travel and e-commerce.
Holiday Season Highlights (November 1 – December 31):
- US consumer holiday spending growth in line with last year
- Retail holiday spending slightly better than prior year, led by strong e-commerce growth
- E-commerce continues taking greater share of consumer retail spend
- Similar trends in key countries globally, with retail spending up from prior year
US Spending Dynamics:
- Credit +7%, debit +6% year-over-year
- E-commerce growing faster than face-to-face
- Growth across consumer spend bands relatively consistent; highest spend band growing fastest
- No deterioration in lower spend band; both discretionary and non-discretionary spend remained strong
How Did Revenue Break Down by Segment?
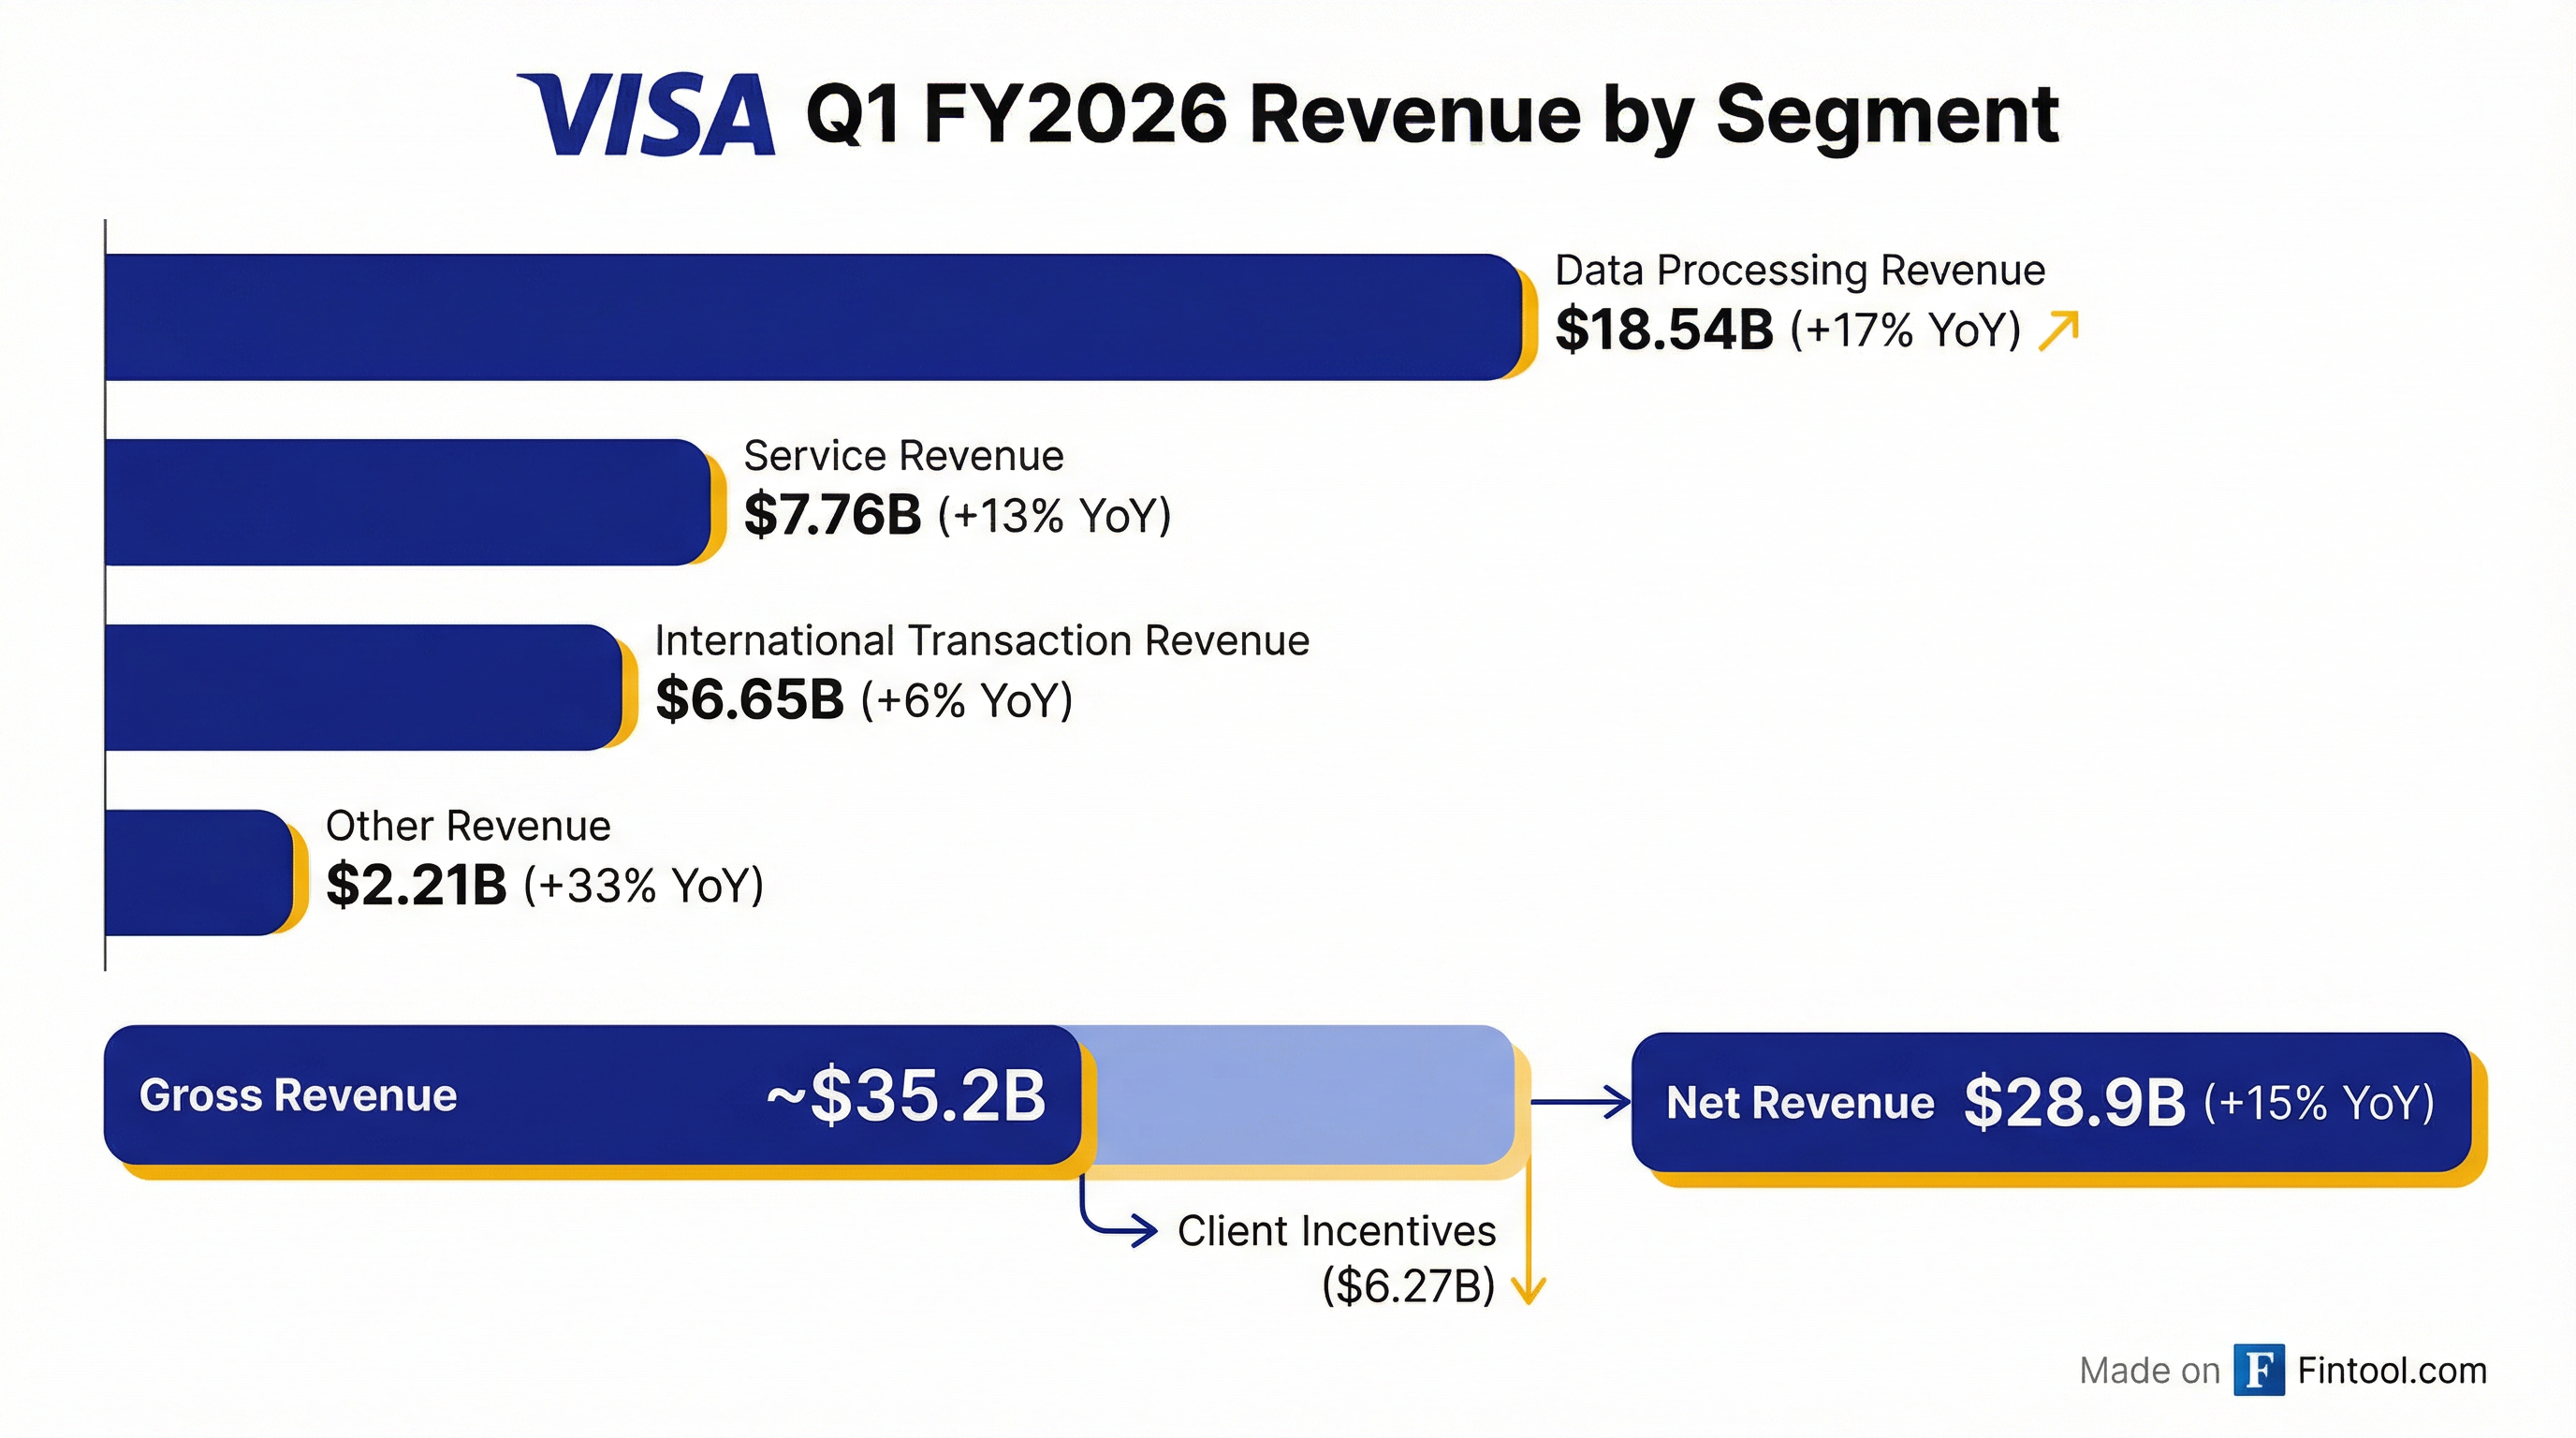
Key observations:
- Data Processing (+17%) was the fastest-growing major segment, driven by pricing, VAS performance, and higher cross-border mix
- Other Revenue (+33%) showed exceptional growth, primarily from advisory and marketing services demand
- International Transaction Revenue (+6%) grew below cross-border volume due to lower-than-expected volatility, mix, and hedging impacts
- Client Incentives (+12%) lower than expected due to one-time write-downs related to client performance and deal timing
Growth Pillars Performance
Visa's three strategic growth pillars all delivered strong results:
Value-Added Services breakdown:
- Strong growth across all four portfolios: issuing solutions, acceptance, risk and security, and advisory
- Advisory and marketing services exceeded expectations, particularly around FIFA World Cup and Olympics activations
What Changed From Last Quarter?
Comparing Q1 FY2026 to Q4 FY2025:
Notable changes:
- Operating expenses declined 9% sequentially despite revenue growth, as Q4 FY2025 included a $903M litigation provision versus $708M in Q1 FY2026
- Net income jumped 15% due to revenue growth and expense leverage
- Tax rate benefited from a $333M deferred tax benefit related to changes in U.S. taxation of foreign earnings
What Did Management Guide?
Visa reaffirmed full-year FY2026 outlook while providing detailed Q2 expectations:
FY2026 Full Year Guidance
Q2 FY2026 Guidance
Key assumption changes:
- Volatility: Much lower than expected in Q1; assuming current levels persist for rest of year, with Q3 having toughest YoY comparable
- Pricing: No material changes; benefits expected similar to last year, majority in back half
- Incentives: Q1 true-downs won't carry into Q2; Q3 expected to have highest YoY incentive growth rate
How Did the Stock React?
Shares rose 1.4% during regular trading on the day of the earnings release, outperforming the broader market. However, after-hours trading saw shares retreat to $326, suggesting some profit-taking or concerns emerging from the earnings call.
52-week range context: $299.00 – $375.51, with current price near the middle of the range.
Capital Allocation Highlights
Visa continued its aggressive capital return program:
The company also deposited $500M into its litigation escrow account on December 23, 2025, which has the same economic effect as share repurchases by reducing the as-converted class B share counts.
Dividend increase: The board declared a quarterly dividend of $0.67 per share, payable March 2, 2026.
Balance Sheet Snapshot
Cash declined from $17.2B to $14.8B primarily due to $4.0B in debt repayments and $5.1B in capital returns.
Litigation Update
Visa recorded a $707M litigation provision in Q1 FY2026 related to the interchange multidistrict litigation (MDL) case.
On November 10, 2025, Visa entered into a superseding and amended settlement agreement to resolve the interchange MDL injunctive relief class claims, subject to court approval.
The company's litigation escrow account held $3.3B as of December 31, 2025, up from $3.0B at the end of September.
8-Quarter Financial Trend
Revenue has grown from $8.78B in Q2 FY2024 to $10.90B in Q1 FY2026, representing a CAGR of approximately 12% over the two-year period.
Strategic Initiatives Update
Agentic Commerce
Visa is positioning itself as critical infrastructure for AI-powered commerce:
"We're working to enable agentic commerce with more than 100 partners across the commerce ecosystem globally. Over 30 partners are actively building in our sandbox with multiple agents and agent enablers running live production transactions."
Key developments:
- AWS partnership: Visa Intelligent Commerce now available on AWS Marketplace for developers building agentic commerce solutions
- B2B expansion: Partnership with Ramp for corporate bill payments
- Security protocols: Partnerships with Cloudflare and Akamai (serving millions of businesses, including 9 of top 10 retailers)
- Global rollout: Live in US and SEMIA; pilots initiating in Asia Pacific and Europe; LAC to follow
Stablecoins
Visa sees stablecoins as additive to its core business:
"We don't see a lot of product-market fit in developed digital payment markets like the United States or like the U.K. or Europe for stablecoin payments... [but] countries around the world where there's high currency volatility or hard to access US dollars" present significant opportunity.
New initiatives:
- Stablecoin advisory practice launched globally
- Visa Direct stablecoin payouts piloting in US for platforms, freelancers, creators
- Blockchain partnerships: Design partner with Tempo Layer 1; participating in Arc testnet from Circle
Tokenization Progress
Visa's token technology continues to scale:
Visa Flex Credential
The multi-funding-source credential is gaining traction:
New wins:
- Block/Cash App: Pilot launched for Cash App Visa Debit Flex card with Afterpay BNPL integration
"We think about the Flex credential like the Swiss Army knife of payments. It's got multiple funding options that are all packed into 1 card."
Issuer Processing (Pismo)
Visa's issuer processing strategy continues to execute:
"Our thesis when we bought Pismo was that our clients were facing big decisions on how they could modernize their tech stacks and ultimately move into the cloud. And that's what's proving out."
First commercial offerings since acquisition:
- Banco Bice (Chile): B2B credit corporate issuer processing with Mendel expense management
- FinanceNow (New Zealand): First fleet card offering with tokenization and risk services
Q&A Highlights
On Value-Added Services Strength
Dan Perlin (RBC): Asked about purpose-built offerings for FIFA and Olympics events.
Ryan McInerney: "What we have through our sponsorships is the ability to pass through those rights to our clients and partners all over the world... For some clients, those might be advertising campaigns... For other clients, they might want to create client events for their private banking clients at one of the FIFA games... Not only are we helping our clients, not only are we generating revenue from these services, we're deepening our partnerships."
On CCCA Regulatory Risk
Will Nance (Goldman Sachs): Asked about Credit Card Competition Act likelihood.
Ryan McInerney: "We're very engaged on the Hill... In the case of CCCA specifically... it's very harmful, and it's just simply not needed... This legislation would have far-reaching negative consequences... Consumers and small businesses would see reduced access to credit. Rewards would be eliminated entirely. There'd be fewer credit card options. And by the way, weaker security protections, less innovation."
On Commercial & Money Movement Solutions
Adam Frisch (Evercore): Asked what unlocked the better-than-expected CMS growth.
Ryan McInerney: Highlighted three strategic pillars: (1) Converting more SMB spending (Chase Sapphire Reserve for Business), (2) Scaling large/middle-market virtual payables (Trip.com global virtual travel card), and (3) Network-agnostic capabilities for underpenetrated spend (BMO Canada win).
On Capital Return Philosophy
Darren Peller (Wolfe Research): Asked about potential changes to buyback approach given valuation.
Chris Suh: "Our approach to capital return and share buyback has largely been programmatic. We've executed on that very consistently throughout our history. But at the same time, we do take advantage. When we see opportunities, when we think the market is underpricing our stock and we see an opportunity, we'll lean in as well."
On Pismo Pipeline
Tinjun Wong (JPMorgan): Asked about Pismo momentum and TAM.
Ryan McInerney: "No change in the TAM. It's enormous... Every bank on the planet, except a few, needs to go through the process of modernizing their tech stack... These are long sales cycles. A bank kind of changing out its core banking infrastructure, moving from on-prem into the cloud, these are big decisions."
Key Risks and Considerations
-
Litigation overhang: The MDL settlement remains subject to court approval, and continued provisions could pressure earnings
-
Currency headwinds: Constant-dollar revenue growth of 13% versus nominal 15% highlights ongoing FX impact
-
Regulatory scrutiny: Management noted "increased scrutiny and regulation of the global payments industry" as an ongoing risk
-
Client incentives: While growing slower than revenue this quarter, client incentives of $4.3B represent 39% of gross revenue
Through January 21 Trends
Management provided updated driver trends through January 21, 2026 (in constant dollars):
What to Watch Next
- Q2 results (late April) for validation of guidance trajectory
- FX volatility — management flagged much lower than expected, with Q3 having toughest YoY compare
- FIFA World Cup / Olympics marketing ROI — expenses concentrated in Q2/Q3 but driving VAS revenue
- CCCA legislative developments — management actively engaging on Capitol Hill
- Pismo wins — large bank modernization deals have long sales cycles